While fundamental analysis examines a company's intrinsic value based on financial metrics, technical analysis takes a different approach. Technicians believe that all available information is already reflected in the stock's price and that historical price patterns tend to repeat themselves. Learning technical analysis can help you time entries and exits, identify trends, and manage risk.
What Is Technical Analysis?
Technical analysis studies historical price and volume data to predict future price movements. Rather than evaluating a company's profits or competitive position, technicians focus on supply and demand dynamics reflected in trading activity.
The core assumptions of technical analysis are:
- Market prices reflect all relevant information
- Prices move in trends that tend to persist
- Historical patterns tend to repeat
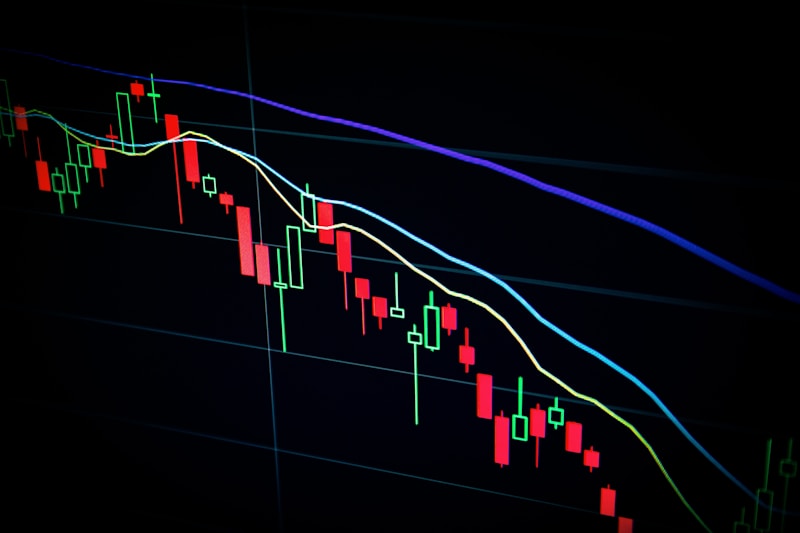
Reading Price Charts
Line Charts
The simplest chart type, connecting closing prices over time. Useful for identifying long-term trends but doesn't show daily volatility.
Bar Charts (OHLC)
Each bar shows the open, high, low, and closing prices for the period. This reveals more detail about price action and intraday movement.
Candlestick Charts
Candlesticks provide the same information as bar charts but in a more visual format. Green (or white) candles indicate up days; red (or black) candles show down days. The shape and size of candlesticks convey market sentiment.

Understanding Trends
Uptrend
An uptrend consists of higher highs and higher lows. Each peak exceeds the previous peak, and each trough remains above the prior trough. Traders look to buy during pullbacks toward support levels.
Downtrend
A downtrend features lower highs and lower lows. Each peak is lower than the previous, and each trough drops further. Traders may short positions or wait for trend reversal signals.
Sideways/Range-Bound
When prices move between horizontal support and resistance levels, the stock lacks clear direction. This often precedes significant breakouts.
Trendlines
Drawing trendlines connecting significant highs (for resistance) or lows (for support) helps identify trend direction and potential reversal points. The more times a trendline is tested, the more significant it becomes.
Key Chart Patterns
Head and Shoulders
A reversal pattern signaling potential trend change. Consists of a left shoulder, head (highest point), right shoulder, and neckline. A break below the neckline confirms the reversal.
Double Top/Bottom
Double tops signal resistance rejection twice at similar levels—a bearish reversal. Double bottoms show support held twice—a potential bullish reversal.
Triangles
Ascending, descending, and symmetrical triangles are continuation patterns. The breakout direction typically continues the prior trend.
Technical Indicators
Moving Averages
Moving averages smooth price data to identify trends. The 50-day moving average is commonly used for medium-term trends; the 200-day for long-term trends. When the 50-day crosses above the 200-day, it's called a "golden cross"—bullish. The reverse is a "death cross"—bearish.
Relative Strength Index (RSI)
RSI measures momentum on a 0-100 scale. Readings above 70 suggest overbought conditions; below 30 indicate oversold. Extreme readings can signal potential reversals.
MACD
The Moving Average Convergence Divergence indicator shows the relationship between two moving averages. Signal line crossovers, histogram changes, and divergences from price all generate trading signals.
Bollinger Bands
These bands plot standard deviations above and below a moving average. When bands tighten, volatility is low—a precursor to potential explosive moves. When bands expand, volatility is high.
Support and Resistance
Support
A price level where buying interest is strong enough to overcome selling pressure. Think of it as a "floor" where the stock tends to find buyers.
Resistance
A price level where selling pressure overcomes buying interest. A "ceiling" where the stock struggles to rise above.
When support is broken, it often becomes resistance, and vice versa. The more times these levels are tested, the more significant they become.
Technical vs. Fundamental Analysis
Many successful investors use both approaches. Fundamental analysis identifies what to buy based on business quality and valuation. Technical analysis helps determine when to buy based on entry points and momentum.
For long-term investors, technical analysis can help avoid buying at market peaks and identify accumulation phases during corrections.
Learn more by reading our guide to fundamental analysis.

Maria Arroyo
Certified Financial PlannerMaria helps investors understand when to use different analytical approaches for optimal results.